
 August 24, 2020
Kubernetes offers a convenient graphical user interface with their web dashboard which can be used to create, monitor and manage a cluster. The installation is quite straightforward but takes a few steps to set up everything in a convenient manner.
In addition to deploying the dashboard, we’ll go over how to set up both admin and read-only access to the dashboard. However, before we begin, we need to have a working Kubernetes cluster. You can get started with Kubernetes by following our earlier tutorial.
Once you’ve set up your Kubernetes cluster or if you already had one running, we can get started.
The first thing to know about the web UI is that it can only be accessed using localhost address on the machine it runs on. This means we need to have an SSH tunnel to the server. For most OS, you can create an SSH tunnel using this command. Replace the <user> and <master_public_IP> with the relevant details to your Kubernetes cluster.
ssh -L localhost:8001:127.0.0.1:8001 <user>@<master_public_IP>
After you’ve logged in, you can deploy the dashboard itself with the following single command.
kubectl apply -f https://raw.githubusercontent.com/kubernetes/dashboard/v2.0.0/aio/deploy/recommended.yaml
If your cluster is working correctly, you should see an output confirming the creation of a bunch of Kubernetes components as in the example below.
namespace/kubernetes-dashboard created serviceaccount/kubernetes-dashboard created service/kubernetes-dashboard created secret/kubernetes-dashboard-certs created secret/kubernetes-dashboard-csrf created secret/kubernetes-dashboard-key-holder created configmap/kubernetes-dashboard-settings created role.rbac.authorization.k8s.io/kubernetes-dashboard created clusterrole.rbac.authorization.k8s.io/kubernetes-dashboard created rolebinding.rbac.authorization.k8s.io/kubernetes-dashboard created clusterrolebinding.rbac.authorization.k8s.io/kubernetes-dashboard created deployment.apps/kubernetes-dashboard created service/dashboard-metrics-scraper created deployment.apps/dashboard-metrics-scraper created
Afterwards, you should have two new pods running on your cluster.
kubectl get pods -A
... kubernetes-dashboard dashboard-metrics-scraper-6b4884c9d5-v4z89 1/1 Running 0 30m kubernetes-dashboard kubernetes-dashboard-7b544877d5-m8jzk 1/1 Running 0 30m
You can then continue ahead with creating the required user accounts.
The Kubernetes dashboard supports a few ways to manage access control. In this example, we’ll be creating an admin user account with full privileges to modify the cluster and using tokens.
Start by making a new directory for the dashboard configuration files.
mkdir ~/dashboard && cd ~/dashboard
Create the following configuration and save it as dashboard-admin.yaml file. Note that indentation matters in the YAML files which should use two spaces in a regular text editor.
nano dashboard-admin.yaml
apiVersion: v1 kind: ServiceAccount metadata: name: admin-user namespace: kubernetes-dashboard --- apiVersion: rbac.authorization.k8s.io/v1 kind: ClusterRoleBinding metadata: name: admin-user roleRef: apiGroup: rbac.authorization.k8s.io kind: ClusterRole name: cluster-admin subjects: - kind: ServiceAccount name: admin-user namespace: kubernetes-dashboard
Once set, save the file and exit the editor.
Then deploy the admin user role with the next command.
kubectl apply -f dashboard-admin.yaml
You should see a service account and a cluster role binding created.
serviceaccount/admin-user created clusterrolebinding.rbac.authorization.k8s.io/admin-user created
Using this method doesn’t require setting up or memorising passwords, instead, accessing the dashboard will require a token.
Get the admin token using the command below.
kubectl get secret -n kubernetes-dashboard $(kubectl get serviceaccount admin-user -n kubernetes-dashboard -o jsonpath="{.secrets[0].name}") -o jsonpath="{.data.token}" | base64 --decode You’ll then see an output of a long string of seemingly random characters like in the example below.
eyJhbGciOiJSUzI1NiIsImtpZCI6Ilk2eEd2QjJMVkhIRWNfN2xTMlA5N2RNVlR5N0o1REFET0dp dkRmel90aWMifQ.eyJpc3MiOiJrdWJlcm5ldGVzL3NlcnZpY2VhY2NvdW50Iiwia3ViZXJuZXRlc y5pby9zZXJ2aWNlYWNjb3VudC9uYW1lc3BhY2UiOiJrdWJlcm5ldGVzLWRhc2hib2FyZCIsImt1Y mVybmV0ZXMuaW8vc2VydmljZWFjY291bnQvc2VjcmV0Lm5hbWUiOiJhZG1pbi11c2VyLXRva2VuL XEyZGJzIiwia3ViZXJuZXRlcy5pby9zZXJ2aWNlYWNjb3VudC9zZXJ2aWNlLWFjY291bnQubmFtZ SI6ImFkbWluLXVzZXIiLCJrdWJlcm5ldGVzLmlvL3NlcnZpY2VhY2NvdW50L3NlcnZpY2UtYWNjb 3VudC51aWQiOiI1ODI5OTUxMS1hN2ZlLTQzZTQtODk3MC0yMjllOTM1YmExNDkiLCJzdWIiOiJze XN0ZW06c2VydmljZWFjY291bnQ6a3ViZXJuZXRlcy1kYXNoYm9hcmQ6YWRtaW4tdXNlciJ9.GcUs MMx4GnSV1hxQv01zX1nxXMZdKO7tU2OCu0TbJpPhJ9NhEidttOw5ENRosx7EqiffD3zdLDptS22F gnDqRDW8OIpVZH2oQbR153EyP_l7ct9_kQVv1vFCL3fAmdrUwY5p1-YMC41OUYORy1JPo5wkpXrW OytnsfWUbZBF475Wd3Gq3WdBHMTY4w3FarlJsvk76WgalnCtec4AVsEGxM0hS0LgQ-cGug7iGbmf cY7odZDaz5lmxAflpE5S4m-AwsTvT42ENh_bq8PS7FsMd8mK9nELyQu_a-yocYUggju_m-BxLjgc 2cLh5WzVbTH_ztW7COlKWvSVbhudjwcl6w
The token is created each time the dashboard is deployed and is required to log into the dashboard. Note that the token will change if the dashboard is stopped and redeployed.
If you wish to provide access to your Kubernetes dashboard, for example, for demonstrative purposes, you can create a read-only view for the cluster.
Similarly to the admin account, save the following configuration in dashboard-read-only.yaml
nano dashboard-read-only.yaml
apiVersion: v1 kind: ServiceAccount metadata: name: read-only-user namespace: kubernetes-dashboard --- apiVersion: rbac.authorization.k8s.io/v1 kind: ClusterRole metadata: annotations: rbac.authorization.kubernetes.io/autoupdate: "true" labels: name: read-only-clusterrole namespace: default rules: - apiGroups: - "" resources: ["*"] verbs: - get - list - watch - apiGroups: - extensions resources: ["*"] verbs: - get - list - watch - apiGroups: - apps resources: ["*"] verbs: - get - list - watch --- apiVersion: rbac.authorization.k8s.io/v1 kind: ClusterRoleBinding metadata: name: read-only-binding roleRef: kind: ClusterRole name: read-only-clusterrole apiGroup: rbac.authorization.k8s.io subjects: - kind: ServiceAccount name: read-only-user namespace: kubernetes-dashboard
Once set, save the file and exit the editor.
Then deploy the read-only user account with the command below.
kubectl apply -f dashboard-read-only.yaml
To allow users to log in via the read-only account, you’ll need to provide a token which can be fetched using the next command.
kubectl get secret -n kubernetes-dashboard $(kubectl get serviceaccount read-only-user -n kubernetes-dashboard -o jsonpath="{.secrets[0].name}") -o jsonpath="{.data.token}" | base64 --decode The toke will be a long series of characters unique to the dashboard currently running.
We’ve now deployed the dashboard and created user accounts for it. Next, we can get started managing the Kubernetes cluster itself.
However, before we can log in to the dashboard, it needs to be made available by creating a proxy service on the localhost. Run the next command on your Kubernetes cluster.
kubectl proxy
This will start the server at 127.0.0.1:8001 as shown by the output.
Starting to serve on 127.0.0.1:8001
Now, assuming that we have already established an SSH tunnel binding to the localhost port 8001 at both ends, open a browser to the link below.
http://localhost:8001/api/v1/namespaces/kubernetes-dashboard/services/https:kubernetes-dashboard:/proxy/
If everything is running correctly, you should see the dashboard login window.
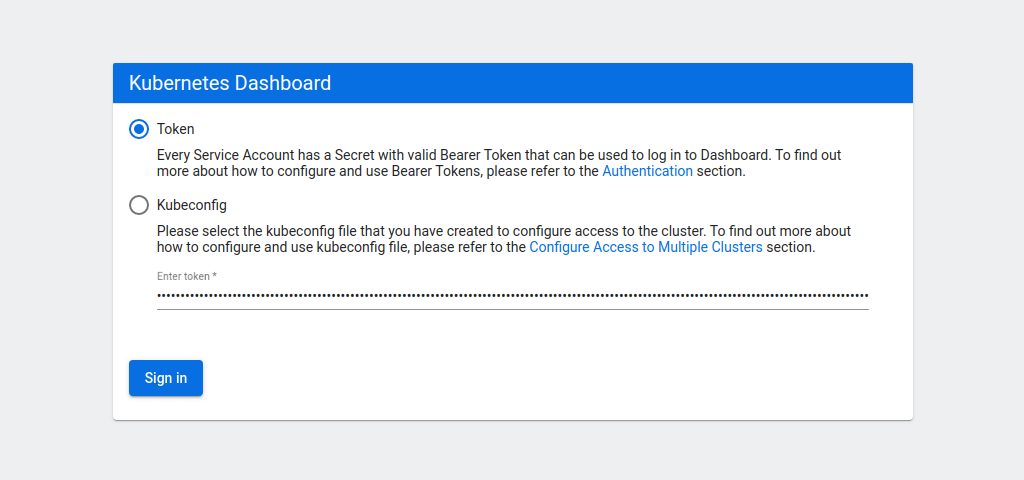
Select the token authentication method and copy your admin token into the field below. Then click the Sign in button.
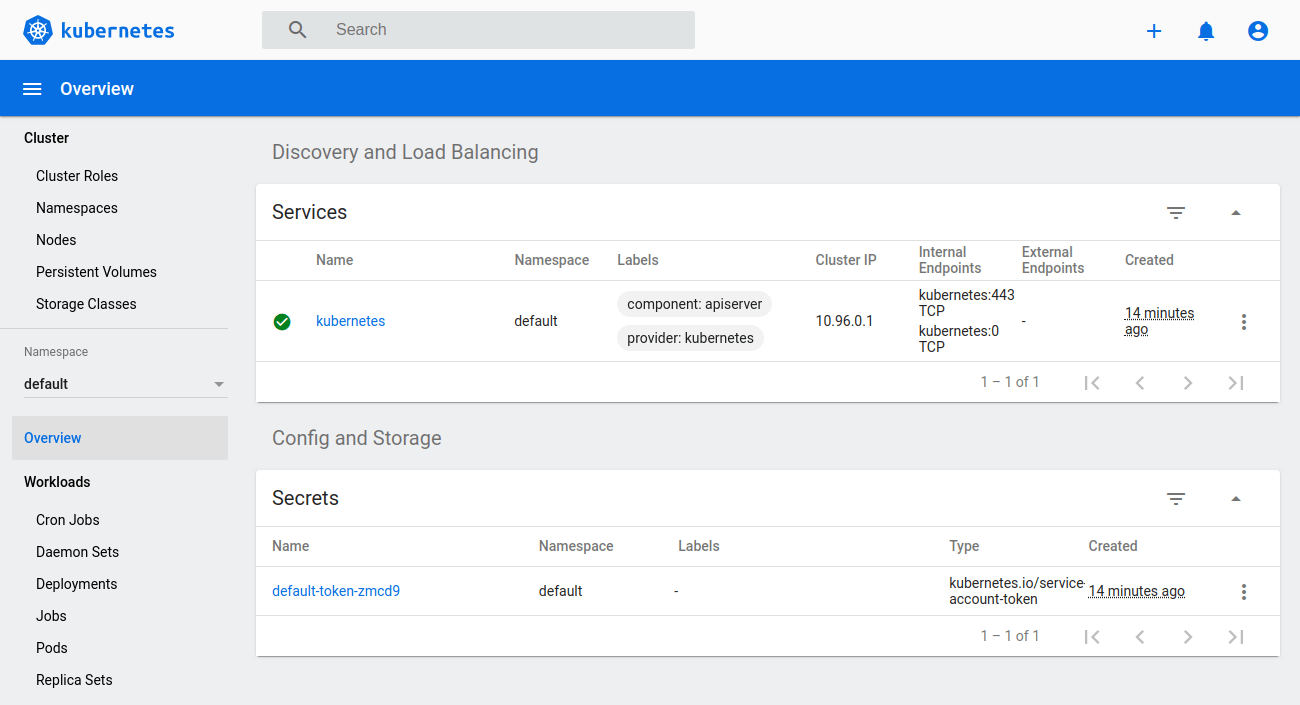
You will then be greeted by the overview of your Kubernetes cluster.
While signed in as an admin, you can deploy new pods and services quickly and easily by clicking the plus icon at the top right corner of the dashboard.
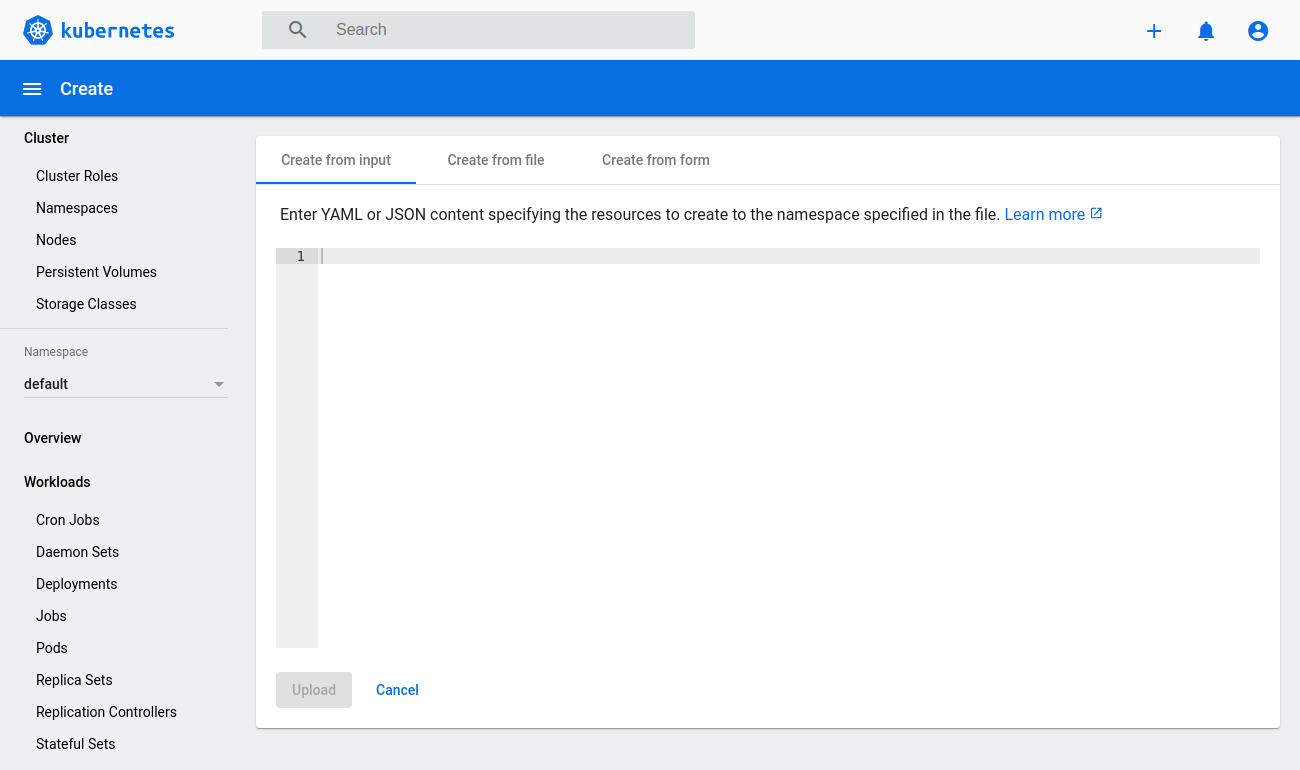
Then either copy in any configuration file you wish, select the file directly from your machine or create a new configuration from a form.
User roles that are no longer needed can be removed using the delete method.
kubectl delete -f dashboard-admin.yaml kubectl delete -f dashboard-read-only.yaml
Likewise, if you want to disable the dashboard, it can be deleted just like any other deployment.
kubectl delete -f https://raw.githubusercontent.com/kubernetes/dashboard/v2.0.0/aio/deploy/recommended.yaml
The dashboard can then be redeployed at any time following the same procedure as before.
The steps to deploy or delete the dashboard are not complicated but they can be further simplified.
The following script can be used to start, stop or check the dashboard status.
nano ~/dashboard/dashboard.sh
#!/bin/bash showtoken=1 cmd="kubectl proxy" count=`pgrep -cf "$cmd"` dashboard_yaml="https://raw.githubusercontent.com/kubernetes/dashboard/v2.0.0/aio/deploy/recommended.yaml" msgstarted="-e Kubernetes Dashboard e[92mstartede[0m" msgstopped="Kubernetes Dashboard stopped" case $1 in start) kubectl apply -f $dashboard_yaml >/dev/null 2>&1 kubectl apply -f ~/dashboard/dashboard-admin.yaml >/dev/null 2>&1 kubectl apply -f ~/dashboard/dashboard-read-only.yaml >/dev/null 2>&1 if [ $count = 0 ]; then nohup $cmd >/dev/null 2>&1 & echo $msgstarted else echo "Kubernetes Dashboard already running" fi ;; stop) showtoken=0 if [ $count -gt 0 ]; then kill -9 $(pgrep -f "$cmd") fi kubectl delete -f $dashboard_yaml >/dev/null 2>&1 kubectl delete -f ~/dashboard/dashboard-admin.yaml >/dev/null 2>&1 kubectl delete -f ~/dashboard/dashboard-read-only.yaml >/dev/null 2>&1 echo $msgstopped ;; status) found=`kubectl get serviceaccount admin-user -n kubernetes-dashboard 2>/dev/null` if [[ $count = 0 ]] || [[ $found = "" ]]; then showtoken=0 echo $msgstopped else found=`kubectl get clusterrolebinding admin-user -n kubernetes-dashboard 2>/dev/null` if [[ $found = "" ]]; then nopermission=" but user has no permissions." echo $msgstarted$nopermission echo 'Run "dashboard start" to fix it.' else echo $msgstarted fi fi ;; esac # Show full command line # ps -wfC "$cmd" if [ $showtoken -gt 0 ]; then # Show token echo "Admin token:" kubectl get secret -n kubernetes-dashboard $(kubectl get serviceaccount admin-user -n kubernetes-dashboard -o jsonpath="{.secrets[0].name}") -o jsonpath="{.data.token}" | base64 --decode echo echo "User read-only token:" kubectl get secret -n kubernetes-dashboard $(kubectl get serviceaccount read-only-user -n kubernetes-dashboard -o jsonpath="{.secrets[0].name}") -o jsonpath="{.data.token}" | base64 --decode echo fi Once all set, save the file and exit the text editor.
Then make the script executable.
chmod +x ~/dashboard/dashboard.sh
Next, create a symbolic link to the dashboard script to be able to run it from anywhere on the system.
sudo ln -s ~/dashboard/dashboard.sh /usr/local/bin/dashboard
You can then use the following commands to run the dashboard like an application.
Start the dashboard and show the tokens
dashboard start
Check whether the dashboard is running or not and output the tokens if currently set.
dashboard status
Stop the dashboard
dashboard stop
Congratulations, you have successfully installed the Kubernetes dashboard! You can now start getting familiar with the dashboard by exploring the different menus and views it offers.


To create the login user one should use
kubectl create token admin-user -n kubernetes-dashboard
how do i access the dashboard away from the local host but on any PC connected to the internet?
Hi Chileshe, thanks for the question. The dashboard runs on localhost but you can access it from any other computer by first establishing an SSH tunnel as explained in the first section of this tutorial.
I can not find any references about “pgrep -cf” in your script. Can you explain more? I stuck at here. My shell doesn’t recognize any “pgrep -cf ” especially option flag ‘-c’.
After initiating the proxy:
# kubectl proxy –address=’0.0.0.0′ –accept-hosts=’^*$’ &
I was able to get the dashboard login screen to come up when I visited the site from my laptop going to the dashboard.
When I entered the token that I generated using the command:
# kubectl get secret -n kubernetes-dashboard $(kubectl get serviceaccount admin-user -n kubernetes-dashboard -o jsonpath=”{.secrets[0].name}”) -o jsonpath=”{.data.token}” | base64 –decode
I got nowhere, it stayed on the main login screen.
Hi Team,
While accessing kube dashboard ,getting this error in UI
Error trying to reach service: ‘Address is not allowed’
any help
I’m using the highest version of dashboard:
https://kubernetes.io/docs/tasks/access-application-cluster/web-ui-dashboard/
kubectl apply -f https://raw.githubusercontent.com/kubernetes/dashboard/v2.3.1/aio/deploy/recommended.yaml
https://zapodaj.net/04fa920a7420e.jpg.html
After generating the token and typing it in, my button is still grayed out what could be a problem?
whatever I type the button doesn’t work.
root@k8s-master01:~# kubectl proxy –address=’0.0.0.0′ –accept-hosts=’^*$’
Starting to serve on 0.0.0.0:8001
Hi, thanks for the detailed info, however I followed each and every step mentioned and all my pods and services are up and running. I created the tunnel as well on my pc towards master’s localhost:8001 but i cant open the dashboard and getting the error ” error trying to reach the service : gateway timeout” reason “service Unavailable” code “53”.
Can you help with the workaround?
Regards
Karan
Saved many hours, superb
How do I make this accessible via public_ip instead of localhost. Am running k8s on a server and need to be able to access it from the browser on my PC
Thank you
i tried these steps, i got “Forbidden” instead of the dashboard
Thanks, How can I access dashboard externally with loadbalancer?
thank ..it really helped me.
Awesome. This saved me countless hours Many thanks
Great work ! many thanks
Hi Kiran, thanks for the question. Guessing by the error message, the dashboard proxy seems to be redirected to the wrong address. I’d suggest testing it out with the localhost again first before enabling a public IP address.
Hi Janne, thank you for the detailed document. saved a lot of time. I have a question. I am not able to access the dashboard using the master node IP.
I started the proxy with the master node ip in –address but no luck.
I am able to navigate the URL upto “http://172.16.181.20:8001/api/v1/namespaces/kubernetes-dashboard/services/” but when i use the other part of the URL “http://172.16.181.20:8001/api/v1/namespaces/kubernetes-dashboard/services/https:kubernetes-dashboard:/proxy/” then i get below error.
{
“kind”: “Status”,
“apiVersion”: “v1”,
“metadata”: {},
“status”: “Failure”,
“message”: “error trying to reach service: dial tcp 192.168.231.68:8443: i/o timeout”,
“reason”: “ServiceUnavailable”,
“code”: 503
}
Hey there! For pgrep you can check the Linux tutorial page here: https://man7.org/linux/man-pages/man1/pgrep.1.html and the flag -c is for count.
Hi John, thanks for the comment. Check that you are using HTTPS to access the dashboard login screen. The login page will not let you in via insecure connection.
Hi Amir, thanks for the comment. This could be related to the HTTPS enforcement on the dashboard side. Make sure you are connecting to the dashboard over HTTPS or using the localhost.
Hi Arek, thanks for the comment. It seems that the Dashboard is blocking sign in over insecure connection. You’ll need to use HTTPS or localhost access to be able to log in.
Hi Karan, thanks for the comment. Check that your SSH tunnel is active and mapping the port correctly. Also, make sure the kubectl proxy is up and running. If both of these are fine, then the issue is likely with the dashboard pod itself.
Hi Mwabini, thanks for the question. You can start the proxy on other than localhost by defining the address. Note that you’ll also need to set which hosts are allowed to access the dashboard. The below command allows all hosts.
Hi Tinashe, make sure you open the SSH tunnel to the localhost when connecting to your Kubernetes server to be able to reach the dashboard. Once the tunnel is working, check that your proxy is running at 127.0.0.1:8001.
Hi Mohammad, thanks for the question. While you could use a load balancer as a reverse proxy to make the dashboard available externally, you might first want to try setting the bind-address on the proxy command instead, for example:
kubectl proxy --address={your-server-ip} --port=8001